PTC tasting: The myth
To some people, small amounts of the compounds phenylthiocarbamide (PTC) or propylthiouracil (PROP) taste very bitter; other people do not taste these compounds. The myth is that there are only two kinds of people, tasters and non-tasters, and that the trait is controlled by a single gene, with the allele for tasting dominant over the allele for non-tasting.
The reality
PTC tasting as a character
Fox (1932) was working in a lab with phenylthiocarbamide (PTC) when a colleague complained about the bitter taste of the chemical dust Fox was spreading around. Fox insisted that it was tasteless; to settle the disagreement, he had other colleagues taste the PTC and discovered that it had a strong bitter taste for some people, while others found it tasteless. This led to a large body of research on PTC tasting; Guo and Reed (2001) review the subject and cite 392 references, and there has been more work done since then. For most of the myths in this series, I had to dig deep to find every obscure scrap of information, but for PTC, I am just skimming the surface. The reviews by Guo and Reed (2001), Kim and Drayna (2004) and Wooding (2006) are good places to start if you'd like more information.
Testing methods
Some of the early studies put PTC crystals directly on the tongue, while others used solutions of PTC or paper soaked in PTC and then dried. However, some people would be classified as tasters with one technique and non-tasters with a different technique (Hartmann 1939, Lawless 1980).
The most common method for measuring the ability to taste PTC involves finding the weakest concentration of PTC that tastes different from plain water (Blakeslee 1932). The technique of Harris and Kalmus (1950) for threshold measurement has been widely used, sometimes with small modifications. The subject is given a two-fold dilution series of PTC, starting with the weakest concentration and going up until they say they can taste it. The subject is then asked to sip four PTC solutions of that concentration and four plain waters, and identify which are PTC. If they get it correct, the next weaker solution is tried; if they get it incorrect, the next stronger solution is tried. The weakest PTC solution that the subject can correctly identify is the threshold.
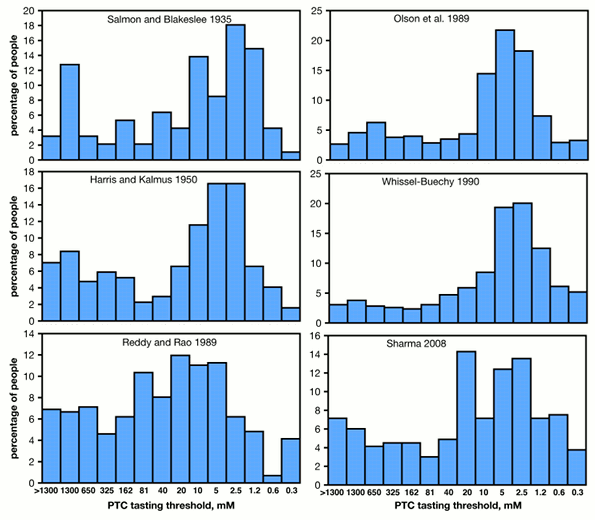
Harris and Kalmus (1950) found that the distribution of PTC tasting thresholds was bimodally distributed, but there were some intermediate individuals. Other studies have found similar results, a bimodal distribution with some intermediate individuals (Blakeslee 1932, Salmon and Blakeslee 1935, Falconer 1947, Olson et al. 1989, Whissell-Buechy et al. 1990, Guo et al. 1998, Drayna et al. 2003).
 |
| Percentage of people with different PTC-tasting thresholds. ">1300" indicates people who could not taste PTC at the highest concentration, 1300 mM. |
A different way to measure PTC tasting is to give each subject an intermediate concentration of PTC solution, then ask them to rate it on a numeric scale, such as 0 (no taste) to 7 (very strong taste) (Lawless 1980). This category rating method is much quicker than the threshold detection method of Harris and Kalmus (1950) and exposes the subjects to much less PTC. It may also do a better job of separating people into two distinct categories, taster and non-taster (Lawless 1980), but it has not been used very often.
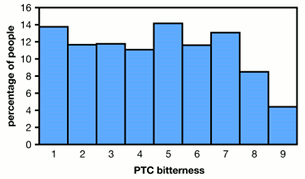
In classrooms, the usual way to test PTC tasting is by having students taste a piece of paper that has been soaked in PTC. Some individuals who are classified as tasters using paper are non-tasters using a threshold test, and vice versa (Hartmann 1939, Lawless 1980). Khataan et al. (2009) asked subjects to taste a piece of paper containing 3 µg of PTC and rate it from 1 (not at all bitter) to 9 (extremely bitter). The variation among 911 subjects was not at all bimodal.
 |
| Percentage of people with different scores on a PTC bitterness scale. Data from the three genotypes in Khataan et al. (2009) combined. |
Individual variation
Salmon and Blakeslee (1935) measured the PTC threshold of 12 people repeatedly over a period of several days. Each subject had different thresholds at different times; in the most extreme case, one person sometimes had a threshold of 0.4 mM while another time had a threshold of 100 mM. In other subjects tested repeatedly throughout a day, the threshold varied by as much as eightfold over as short as 15 minutes.
Whissell-Buechy (1990) retested 30 subjects after one year. Using a dividing line between taster and non-taster based on a much larger sample, three of the 30 retested individuals would have changed between "taster" and "non-taster."
A number of studies have reported that the sensitivity to PTC is lower (the threshold concentration is higher) in older people (Harris and Kalmus 1950, Olson et al. 1989, Whissel-Buechy 1990). Kalmus and Trotter (1962) retested 110 people after about 15 years and found an increase in the average threshold; two people changed between taster and non-taster.
PTC versus PROP
Wheatcroft and Thornburn (1972) pointed out that PTC has been found to be toxic in rats, and that while the Harris and Kalmus (1950) protocol recommends spitting out the test solutions, a complete non-taster who swallowed all of the solutions would swallow an amount of PTC that is frighteningly close to a lethal dose. Many studies have used propylthiouracil (PROP) instead of PTC. Like PTC, PROP tastes very bitter to some people and is tasteless to others. Lawless (1980) found that there was a general agreement between the two compounds: most people who found a dilute solution of PTC to be bitter also found a dilute solution of PROP to be bitter. However, the range of thresholds for PROP was narrower and the distribution less bimodal than for PTC, making it even more difficult to separate people into tasters and non-tasters with PROP. Bufe et al. (2005) found that the association with TAS2R38 haplotypes was stronger for PTC than for PROP.
Family studies
Blakeslee (1932) divided individuals into PTC tasters (T) and non-tasters (NT) and obtained the following results from a set of 103 families:
| Parents | T offspring | NT offspring |
|---|---|---|
| T x T | 109 | 22 |
| T x NT | 42 | 32 |
| NT x NT | 0 | 22 |
Because there were no taster offspring of two non-taster parents, this fits the model of PTC tasting being determined by two alleles of a single gene, with tasting being dominant over non-tasting.
Merton (1958) examined 60 Norwegian families and found similar results, except that there were five taster offspring of two non-taster parents:
| Parents | T offspring | NT offspring |
|---|---|---|
| T x T | 73 | 16 |
| T x NT | 36 | 14 |
| NT x NT | 5 | 30 |
and Das (1958) examined 126 Indian families:
| Parents | T offspring | NT offspring |
|---|---|---|
| T x T | 191 | 47 |
| T x NT | 137 | 71 |
| NT x NT | 4 | 37 |
Das (1958) took a closer look at the four taster offspring of two non-taster parents. One had a PTC threshold right on the borderline between taster and non-taster. The other three came from a single mother; blood groups revealed that her husband was not the biological father of her three children.
Olson et al. (1989) also found some taster offspring of two non-taster parents:
| Parents | T offspring | NT offspring |
|---|---|---|
| T x T | 194 | 19 |
| T x NT | 117 | 28 |
| NT x NT | 18 | 26 |
They examined blood group data on families of 11 of the taster offspring of two non-taster parents, and three of the offspring were the result of extra-pair mating; the other eight really were taster offspring of two non-taster biological parents.
If PTC tasting were a simple one-gene, two-allele genetic character, with tasting completely dominant to non-tasting, then two non-tasting parents could not have a tasting child. Both Merton (1958) and Olson et al. (1989) found some tasting offspring of non-tasting parents, so the trait must be more complicated than the myth says. The discrepancy could be due to more complicated genetics, involving multiple alleles or multiple genes, or some kind of environmental influence.
Twin studies
Kaplan et al. (1967) tested the taste threshold for PROP on pairs of twins, and found that pairs of monozygotic twins were more similar than pairs of dizygotic twins. However, out of 75 pairs of monozygotic twins, seven of the pairs had one taster twin and one non-taster twin. Martin (1975) looked at 28 pairs of monozygotic twins and did not find any taster/non-taster pairs. Sharma (2008) found that none of a sample of 66 monozygotic twin differed by more than 3 units on the Harris-Kalmus scale of PTC threshold, while 26 out of 75 dizygotic twins differed by more than 3 units.
Molecular genetics
Drayna et al. (2003) used linkage to DNA polymorphisms in 26 large families and found that much of the variation in PTC tasting was associated with chromosome 7, while some variation was associated with chromosome 16.
Kim et al. (2003) extended the linkage mapping of Drayna et al. (2003) and found that variation in a single gene, TAS2R38, explains much of the variation in PTC tasting. The gene has a single exon that is 1002 base pairs long. There are three amino acid polymorphisms: alanine/proline (A/P) at amino acid position 49, valine/alanine (V/A) at position 262, and isoleucine/valine (I/V) at position 296. The three polymorphisms have 8 possible combinations (haplotypes), but two make up more than 95 percent of all haplotypes in European and Asian populations: AVI and PAV, named after the amino acids at positions 49, 262 and 296. AVI/AVI homozygotes are mostly non-tasters, while AVI/PAV heterozygotes and PAV/PAV homozygotes are mostly tasters. The AAV haplotypes was present at a frequency of 3 percent in Europe, while AAV, AAI and PVI were found only in sub-Saharan African populations. Several nonhuman primate species had the PAV haplotype, meaning that the AAV and other haplotypes originated after the human lineage split from the chimp lineage.
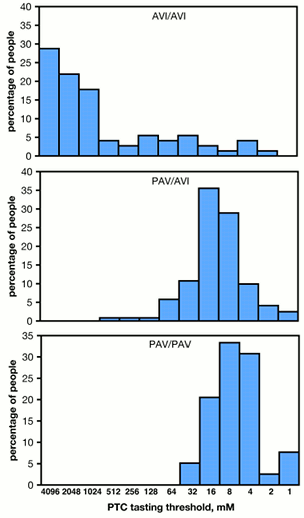
The average PTC tasting thresholds were lowest for PAV/PAV homozygotes, slightly higher for AVI/PAV heterozygotes, and much higher for AVI/AVI homozygotes (Kim et al. 2003). There was, however, considerable overlap, suggesting that PTC tasting threshold is affected by other genes or environmental factors.
 |
| Percentage of people with PTC tasting thresholds, for the three common haplotypes at the TAS2R38 gene. Combined data from the Utah and NIH samples in Kim et al. (2003). |
Wooding et al. (2004) sequenced the coding region of TAS8R38 in 165 humans, one common chimp and one gorilla. They applied a number of statistical tests for evidence of natural selection. There were more intermediate-frequency polymorphisms than expected for a human gene, which suggests that balancing selection may be affecting the gene.
Bufe et al. (2005) gave people different concentrations of PTC and asked them to rate the bitterness. At the higher concentrations, there was no overlap in bitterness score between AVI/AVI homozygotes and PAV/PAV homozygotes, but AVI/PAV heterozygotes had a range of bitterness scores that overlapped both homozygotes. They did the same experiment with PROP and found a much weaker association with TAS2R38 genotype; the highest concentration of PROP tasted very bitter to some AVI/AVI individuals and did not taste bitter to some PAV/PAV individuals.
Conclusion
PTC tasting is largely determined by a single gene, TAS2R8, with two common alleles, and the allele for tasting is mostly dominant over the allele for non-tasting. However, both classical family and twin studies, and modern molecular genotyping, show that there are other genes or environmental factors that influence PTC tasting. As a result, there is a continuous range of PTC tasting, not absolute separation into tasters and non-tasters. PTC tasting would be a fascinating subject for an advanced genetics class, but it does not fit the one-gene, two-allele myth well enough to be used to demonstrate simple Mendelian genetics.
References
Blakeslee, A. F. 1932. Genetics of sensory thresholds: taste for phenyl thio carbamide. Proceedings of the National Academy of Sciences of the USA 18: 120-130.
Bufe, B., P. A. S. Breslin, C. Kuhn, D. R. Reed, C. D. Tharp, J. P. Slack, U.-K. Kim, D. Drayna, and W. Meyerhof. 2005. The molecular basis of individual differences in phenylthiocarbamide and propylthiouracil bitterness perception. Current Biology 15: 322-327.
Das, S. R. 1958. Inheritance of the PTC taste character in man: An analysis of 126 Rarhi Brahmin families of West Bengal. Annals of Human Genetics 22: 200-212.
Drayna, D., H. Coon, U.-K. Kim, T. Elsner, K. Cromer, B. Otterud, L. Baird, A. P. Peiffer, and M. Leppert. 2003. Genetic analysis of a complex trait in the Utah Genetic Reference Project: a major locus for PTC taste ability on chromosome 7q and a secondary locus on chromosome 16p. Human Genetics 112: 567-572.
Falconer, D.S. 1947. Sensory threshholds for solutions of phenyl-thio-carbamide: results of tests on a large sample, made by R.A. Fisher. Annals of Eugenics 13: 211-222.
Fox, A. L. 1932. The relationship between chemical constitution and taste. Proceedings of the National Academy of Sciences of the USA 18: 115-120.
Guo, S. W., and D. R. Reed, 2001 The genetics of phenylthiocarbamide perception. Annals of Human Biology 28: 111Ð142.
Guo, S. W., F. M. Shen, Y. D. Wang, and C. J. Zheng. 1998. Threshold distributions of phenylthiocarbamide (PTC) in the Chinese population. Annals of the New York Academy of Sciences 855: 810-812.
Harris, H., and H. Kalmus. 1950. The measurement of taste sensitivity of phenylthiourea (PTC). Annals of Eugenics 15: 24-31.
Hartmann, G. 1939. Application of individual taste difference towards phenyl-thio-carbamide in genetic investigations. Annals of Eugenics 9: 123-135.
Kalmus, H., and W. R. Trotter. 1962. Direct assessment of the effect of age on PTC sensitivity. Annals of Human Genetics 26: 145-149.
Kaplan, A. R., R. Fischer, A. Karras, F. Griffin, W. Powell, R. W. Marsters, and E. V. Glanville. 1967. Taste threshholds in twins and siblings. Acta Geneticae Medicae et Gemollologiae 16: 229-241.
Khataan, N. H., L. Stewart, D. M. Brenner, M. C. Cornelis, and A. El-Sohemy. 2009. TAS2R38 genotypes and phenylthiocarbamide bitter taste perception in a population of young adults. Journal of Nutrigenetics and Nutrigenomics 2: 251-256.
Kim, U.-K., and D. Drayna. 2004. Genetics of individual differences in bitter taste perception: lessons from the PTC gene. Clinical Genetics 67: 275-280.
Kim, U. K., E. Jorgenson, H. Coon, M. Leppert, N. Risch, and D. Drayna. 2003. Positional cloning of the human quantitative trait locus underlying taste sensitivity to phenylthiocarbamide. Science 299: 1221-1225.
Lawless, H. 1980. A comparison of different methods used to assess sensitivity to the taste of phenylthiocarbamide (PTC). Chemical Senses 5: 247-256.
Martin, N. G. 1975. Phenylthiocarbamide testing in a sample of twins. Annals of Human Genetics 38: 321-326.
Merton, B. B. 1958. Taste sensitivity to PTC in 60 Norwegian families with 176 children: confirmation of the hypothesis of single gene inheritance. Acta Genetica et Statistica Medica 8: 114-128.
Olson, J. M., M. Boehnke, K. Neiswanger, A. F. Roche, and R. M. Siervogel. 1989. Alternative genetic models for the inheritance of the phenylthiocarbamide taste deficiency. Genetic Epidemiology 6: 423-434.
Salmon, T.N., and A. F. Blakeslee. 1935. Genetics of sensory thresholds: variations within single individuals in taste sensitivity for PTC. Proceedings of the National Academy of Sciences of the USA 21: 78-83.
Sharma, K. 2008. Comparing sensory experience in bitter taste perception of phenylthiocarbamide within and between human twins and singletons: Intrapair differences in thresholds and genetic variance estimates. Anthropologischer Anzeiger 66: 211-224.
Wheatcroft, P. E. J., and C. C. Thornburn. 1972. Toxicity of the taste testing compound phenylthiocarbamide. Nature New Biology 235: 93-94.
Whissell-Buechy, D. 1990. Effects of age and sex on taste senstitivity to phenylthiocarbamide (PTC) in the Berkeley Guidance sample. Chemical Senses 15: 39-57.
Wooding, S. 2006. Phenylthiocarbamide: A 75-year adventure in genetics and natural selection. Genetics 172: 2015-2023.
Wooding, S., U.-K. Kim, M. J. Bamshad, J. Larsen, L. B. Jorde, and D. Drayna. 2004. Natural selection and molecular evolution in PTC, a bitter-taste receptor gene. American Journal of Human Genetics 74:637-646.
Return to John McDonald's home page
This page was last revised December 8, 2011. Its address is http://udel.edu/~mcdonald/mythptc.html. It may be cited as pp. 54-60 in: McDonald, J.H. 2011. Myths of Human Genetics. Sparky House Publishing, Baltimore, Maryland.
©2011 by John H. McDonald. You can probably do what you want with this content; see the permissions page for details.
