

Identifying salt patches and marsh
Photos courtesy of Manan Sarupria April 24, 2025
UD researchers combine field data and machine learning algorithm to find salt patches on farmland tripled since 2011 in Delmarva
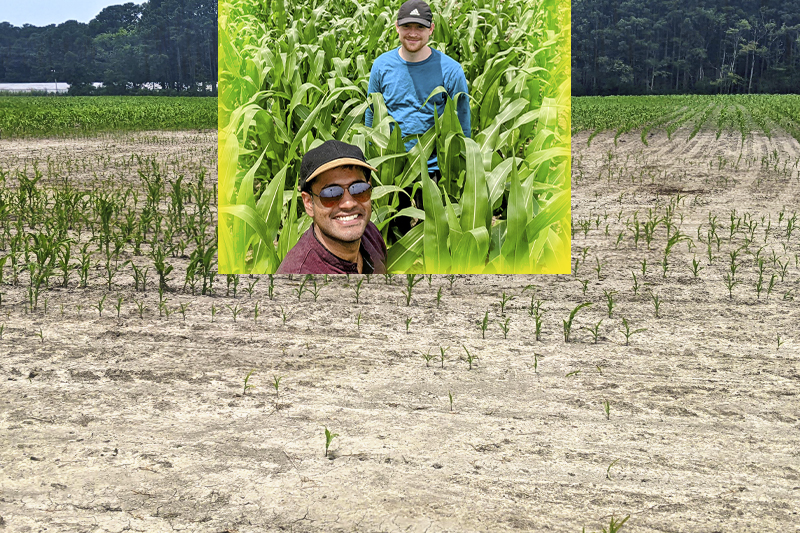
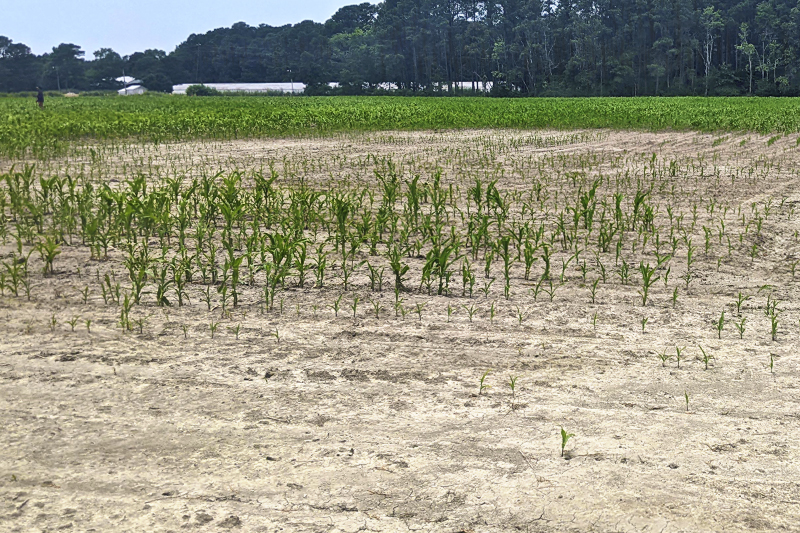
Salty soils are causing reduced crop density, lower yields and barren lands unable to sustain crop growth. Sea level rise, intense storm surges and the overextraction of groundwater are driving this increasing salinity in coastal farmlands throughout the Delmarva region.
When saltwater intrudes onto cropland, large swaths are rendered unsuitable for crop production. Visible salt patches appear on the soil, and, in some cases, areas once used for growing crops may fully convert into marshes.
At the University of Delaware, Pinki Mondal, associate professor and environmental science director in the Department of Geography and Spatial Sciences, and her lab group have examined this phenomenon since 2019. In 2023, a paper authored by Mondal and collaborators outlined the spread and cost of saltwater intrusion to coastal farms in the Delmarva region from 2011-2017, showing that 19,000 acres of cropland had been converted to marsh.
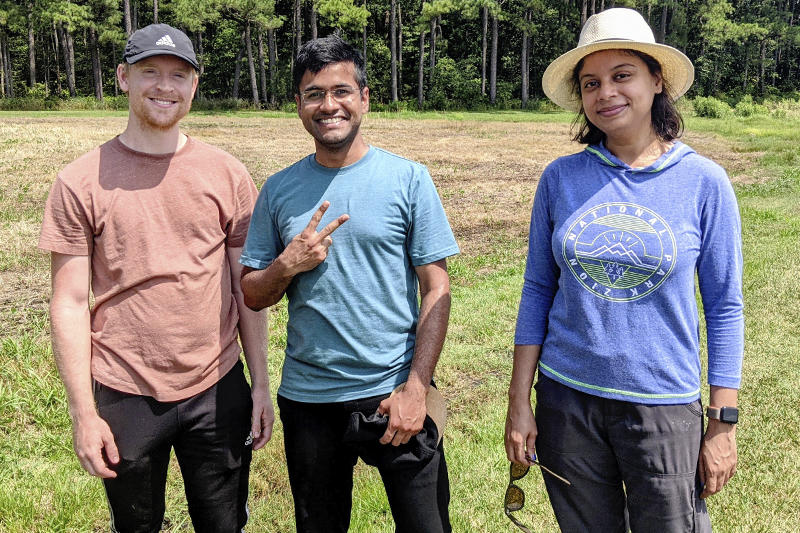
In 2022, Manan Sarupria and Matthew Walter, doctoral students in Mondal’s lab in the College of Earth, Ocean and Environment (CEOE) at the time, visited farms around Delmarva to map salt patches and collect data points. Combining this information with current and historical satellite data, they trained a machine learning algorithm to assess the history and extent of salt patches throughout the region.
Sarupria, who successfully defended his dissertation this spring, is building on that research with a recently published paper in the journal Remote Sensing of Environment that presents a new method for evaluating the differences in land covers over a large geographic scale.
For this study, Sarupria was interested in examining the proportion of Delmarva farmland land cover that was identified as salt patches or marshes.

Having used drone images of salt patches on farms collected by Mondal’s collaborator, Jarrod Miller, associate professor in the College of Agriculture and Natural Resources, Cooperative Extension specialist in agronomy and a coauthor on the study, Sarupria knew that drones could provide high-resolution images for individual farms. However, to cover a larger area, he would need to rely on satellite images to show the spread of salt patches and marsh over a longer period, and these satellite images tend to be lower resolution than drone images.
“We used satellite images from the European Space Agency (ESA) mission Sentinel-2, which is freely available to the public and covers the entire planet every five days. That’s an incredibly high resolution in time,” Sarupria said. “That gives us a lot more information for each pixel compared to the drone image, but the drone image helps us to know exactly where the salt patches are occurring, and we can then map them on the satellite image. We trained a machine learning algorithm to use both types of images.”
Each satellite image studied by the algorithm was comprised of a ten-by-ten-meter square, and each square may contain various land covers ranging from grass, road, building roofs, vehicles and ponds.
“Ten meters by ten meters is a big square. When sunlight falls on such big tiles, the satellite gets a mixed signal coming from a mixture of reflections from these different land covers,” Sarupria said. “We trained our machine learning model to understand the pure reflectance properties of each land cover that appears in a square. When it receives something that is a mixture, it can automatically separate the mixture into individual components and tell us what fraction of each land cover is present in a square.”

Sarupria noted that the data and the code they generated in this study are publicly available, so anyone can replicate or expand the study.
“Our method can help with land cover classification of an image at a fractional scale, so you have a better quantification of such intricate land cover classes,” Sarupria said. “We developed certain formulas, the one for salt and the one for marsh were specifically generated for this study, and they helped the machine learning models perform their tasks better in terms of detecting salt patches and marsh. It gave us an accurate measure of the spatial extent of a particular land cover class, and we focused on salt patches and marsh because they are the most prominent land covers when dealing with salinization on coastal landscapes.”
Leveraging this method using data from 2022, Sarupria has developed forthcoming annual datasets for 2019-2023. These datasets are already telling a grim story as the Delmarva Peninsula witnessed a threefold increase in the salt patch area in 2022 compared to 2011.
Mondal’s group intends to make this data available through a new app, similar to their Salt Patch Mapper app, which shows data for 2011-2017. The app can help to identify rapidly salinizing farmlands and suitable adaptation strategies, and shed light on changing landscapes and livelihoods.
Contact Us
Have a UDaily story idea?
Contact us at ocm@udel.edu
Members of the press
Contact us at 302-831-NEWS or visit the Media Relations website

