

Poll: Democrats lead by big margins in Delaware
Photo by iStock | Graphics by Center for Political Communication October 05, 2020
Biden, Carney, Blunt Rochester and Coons bolstered by support among women voters heading into the 2020 election
Democratic presidential nominee Joe Biden holds a commanding lead in Delaware, as do his party’s candidates in the statewide races for governor, U.S. Senator and U.S. Representative.
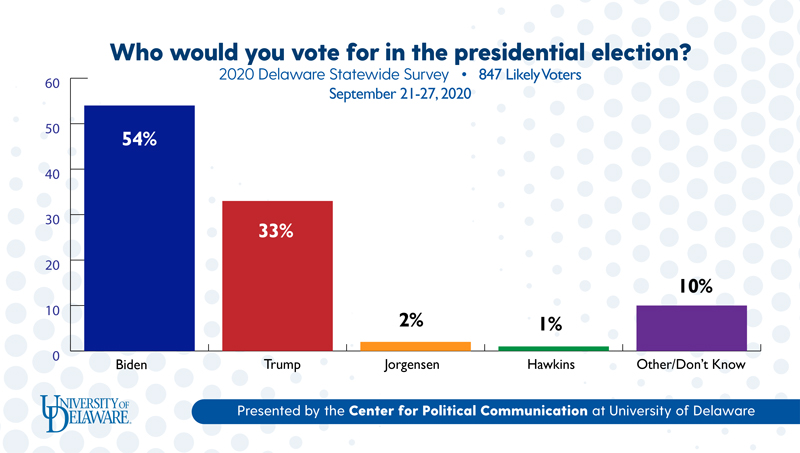
A new University of Delaware Center for Political Communication poll shows that 54% of likely voters in Delaware say they will vote for Biden, while only 33% support President Donald Trump, the Republican nominee. The Democratic candidate’s 21-point lead is well outside the survey’s margin of error.
“The poll results confirm that Biden is the heavy favorite to win his home state’s electoral votes,” said Professor Paul Brewer, Research Director of the Center for Political Communication. “Biden’s margin in Delaware is also consistent with a 7 to 8 point national lead for him.”
In Delaware, Biden leads Trump by more than a two-to-one margin among women (60% to 26%) and New Castle County voters (63% to 26%). The presidential race is much closer among men (46% to 43%), Kent County voters (41% to 44%) and Sussex County voters (40% to 44%).
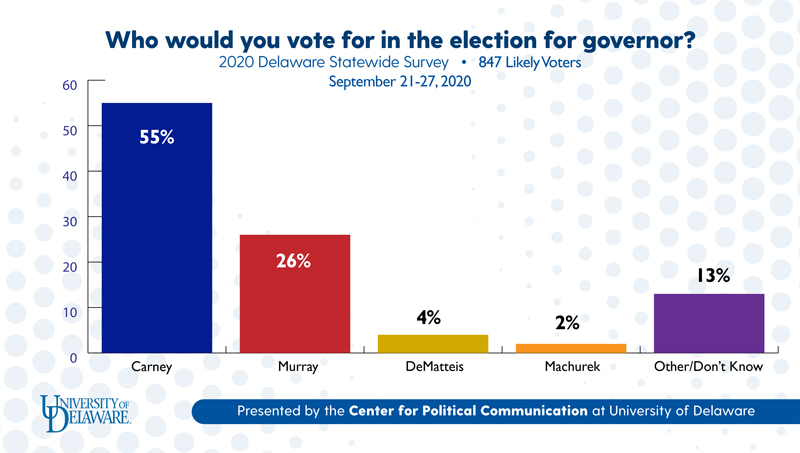
Delaware Gov. John Carney holds a 29-point lead in his race for reelection. Among those polled, 55% support the Democratic incumbent, while 26% of likely voters say they’ll cast their ballot for Republican nominee Julianne Murray.
Carney has a 40-point lead among women (61% to 21%) and a 15-point lead among men (49% to 34%). He holds a three to one margin over Murray in New Castle County (63% to 20%), though the race is closer in Kent County (42% to 34%) and Sussex County (43% to 38%).
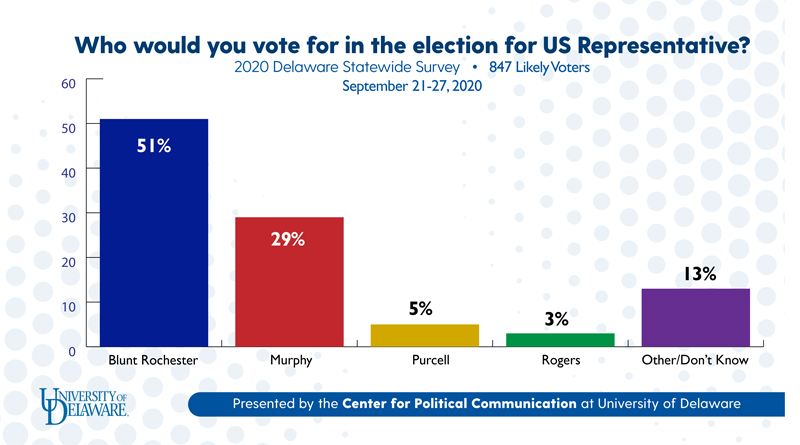
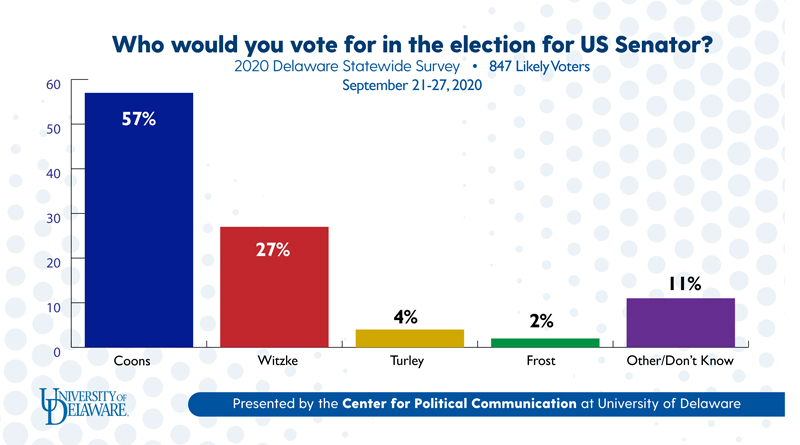
The incumbents are also far ahead in Delaware’s Congressional races. In the U.S. Senate race, Democrat Chris Coons holds a 30-point margin over Republican Lauren Witzke, 57% to 27%. In the U.S. House race, Democrat Lisa Blunt Rochester leads Republican Lee Murphy by 22 points, 51% to 29%.
Coons and Blunt Rochester lead by wide margins among women (63% to 20% for Coons, 57% to 23% for Blunt Rochester) and narrower margins among men (50% to 36% for Coons, 44% to 36% for Blunt Rochester). Both Democrats dominate in New Castle County (67% to 19% for Coons, 58% to 23% for Blunt Rochester). The U.S. Senate race is more competitive in Kent County (Coons 40%, Witzke 30%) and Sussex County (Coons 43%, Witzke 45%). Blunt Rochester holds a smaller lead over Murphy in Kent County (42% to 33%) and is essentially tied with him in Sussex County (41% each).
“The big overall leads for Carney, Coons, and Blunt Rochester reinforce the First State’s status as a solidly blue state,” Brewer said. “Democrats have dominated recent statewide elections in Delaware. So far, none of this year’s Republican candidates shows signs of breaking that pattern.”
About the study
The National Agenda Opinion Project research was funded by the University of Delaware’s Center for Political Communication (CPC) with support from the College of Arts and Sciences. The study was supervised by the CPC’s Research Director, Paul Brewer, a professor in the Departments of Communication and Political Science and International Relations.
The study was fielded by Abt Associates and obtained telephone interviews with a representative sample of 976 adults living in Delaware, including 911 registered voters and 847 likely voters. A total of 327 respondents were interviewed on a landline telephone and 649 were interviewed on a cell phone. Interviewing was conducted from Sept. 21-27, 2020, in English. Samples were drawn from both landline and cell phone random digit dialed (RDD) frames and a list of Delaware registered voters. Both the landline and cell phone RDD samples were provided by Dynata.
Statistical results are weighted for telephone service, sample frame, age, gender, race/ethnicity, education, and voter registration status by county to match the population parameters of the adult population in Delaware. The margin of sampling error for registered voters is ± 4% (the margin of sampling error is larger for results from subsamples). Overall, the response rate (AAPOR RR3) was 2% for the landline RDD sample, 3% for the cell RDD sample, 4% for landline numbers from the RV sample, and 2% for cell numbers from the RV sample.
Please contact Paul Brewer at (302) 831-7771 for more details about the survey’s methodology.
UD Center for Political Communication
2020 Delaware Voters Survey
Final Topline
Sept. 21-27, 2020
N = 847 Delaware Likely Voters
President
Question: If the presidential election were being held today and the candidates were Joe Biden the Democrat, Donald Trump the Republican, Jo Jorgensen the Libertarian, and Howie Hawkins of the Green Party, who would you vote for?

Joe Biden |
Donald Trump |
Jo Jorgensen |
Howie Hawkins |
None/Other/Don’t Know |
||||||
All Respondents |
54% |
33% |
2% |
1% |
10% |
|||||
Women (53%) |
60% |
26% |
1% |
1% |
12% |
|||||
Men (48%) |
46% |
43% |
2% |
0% |
9% |
|||||
Republicans (27%) |
6% |
85% |
1% |
0% |
8% |
|||||
Democrats (41%) |
89% |
4% |
0% |
0% |
6% |
|||||
Independents (28%) |
45% |
37% |
4% |
2% |
13% |
|||||
New Castle Co. (57%) |
63% |
26% |
1% |
1% |
9% |
|||||
Kent Co (18%) |
41% |
44% |
3% |
1% |
10% |
|||||
Sussex Co (25%) |
40% |
44% |
1% |
1% |
14% |
Note: Not all rows sum to 100% due to rounding. Results by party do not report respondents who volunteered another response or did not respond for that question.
Governor
Question: If the election for Delaware Governor were being held today and the candidates were John Carney the Democrat, Julianne Murray the Republican, John Machurek the Libertarian, and Kathy DeMatteis of the Independent Party of Delaware, who would you vote for?

John Carney |
Julianne Murray |
John Machurek |
Kathy DeMatteis |
None/Other/Don’t Know |
|||||
All Respondents |
55% |
26% |
2% |
4% |
13% |
||||
Women (53%) |
61% |
21% |
2% |
3% |
13% |
||||
Men (48%) |
49% |
34% |
2% |
4% |
12% |
||||
Republicans (27%) |
8% |
73% |
1% |
3% |
14% |
||||
Democrats (41%) |
88% |
3% |
1% |
1% |
8% |
||||
Independents (28%) |
51% |
25% |
3% |
9% |
13% |
||||
New Castle Co. (57%) |
63% |
20% |
2% |
2% |
13% |
||||
Kent Co (18%) |
42% |
34% |
2% |
6% |
15% |
||||
Sussex Co (25%) |
43% |
38% |
1% |
7% |
11% |
Note: Not all rows sum to 100% due to rounding. Results by party do not report respondents who volunteered another response or did not respond for that question.
U.S. Representative
Question: If the election for United States Representative were being held today and the candidates were Lisa Blunt Rochester the Democrat, Lee Murphy the Republican, David Rogers the Libertarian, and Catherine Purcell the Independent, who would you vote for?

Lisa Blunt Rochester |
Lee Murphy |
David Rogers |
Catherine Purcell |
None/Other/Don’t Know |
||||||
All Respondents |
51% |
29% |
3% |
5% |
13% |
|||||
Women (53%) |
57% |
23% |
2% |
5% |
13% |
|||||
Men (48%) |
44% |
36% |
4% |
4% |
12% |
|||||
Republicans (27%) |
8% |
76% |
0% |
3% |
12% |
|||||
Democrats (41%) |
86% |
3% |
2% |
1% |
8% |
|||||
Independents (28%) |
37% |
30% |
8% |
11% |
14% |
|||||
New Castle Co. (57%) |
58% |
23% |
3% |
4% |
12% |
|||||
Kent Co (18%) |
42% |
33% |
3% |
6% |
16% |
|||||
Sussex Co (25%) |
41% |
41% |
2% |
4% |
12% |
Note: Not all rows sum to 100% due to rounding. Results by party do not report respondents who volunteered another response or did not respond for that question.
U.S. Senator
Question: If the election for United States Senator were being held today and the candidates were Chris Coons the Democrat, Lauren Witzke the Republican, Nadine Frost the Libertarian, and Mark Turley of the Independent Party of Delaware, who would you vote for?

Chris Coons |
Lauren Witzke |
Nadine Frost |
Mark Turley |
None/Other/Don’t Know |
||||||
All Respondents |
57% |
27% |
2% |
4% |
11% |
|||||
Women (53%) |
63% |
20% |
3% |
2% |
12% |
|||||
Men (48%) |
50% |
36% |
1% |
5% |
8% |
|||||
Republicans (27%) |
10% |
76% |
1% |
1% |
12% |
|||||
Democrats (41%) |
89% |
3% |
1% |
1% |
5% |
|||||
Independents (28%) |
52% |
24% |
4% |
8% |
13% |
|||||
New Castle Co. (57%) |
67% |
19% |
2% |
3% |
10% |
|||||
Kent Co (18%) |
40% |
30% |
3% |
11% |
16% |
|||||
Sussex Co (25%) |
43% |
45% |
1% |
1% |
10% |
Note: Not all rows sum to 100% due to rounding. Results by party do not report respondents who volunteered another response or did not respond for that question.
Contact Us
Have a UDaily story idea?
Contact us at ocm@udel.edu
Members of the press
Contact us at 302-831-NEWS or visit the Media Relations website

