Salt Effects on Crops of the Delmarva Peninsula

Salt Effects on Crops of the Delmarva Peninsula
December 2024 | Written by: Sapana Pohkrel and Jarrod Miller, Extension Specialist - Agronomy
Salts in the Soil
A salt is a compound composed of positively and negatively charged ions (e.g., sodium (Na⁺) and chloride (Cl⁻)). While plants require soluble salts as nutrients, excessive amounts—referred to as soil salinity—can negatively impact their growth. On the Delmarva Peninsula, salinity primarily originates from saline and brackish waters of adjacent water bodies, such as the Chesapeake Bay, leading to saltwater intrusion (SWI). These tidal waters contain not only Na or Cl but also elevated concentrations of other elements, including calcium (Ca), magnesium (Mg), and potassium (K), as well as anions such as sulfate (SO₄²⁻), and boron (B) (Millero et al., 2008). Notably, seawater has a higher concentration of Mg compared to other cations. This trend is reflected in some salinity-affected soil samples (Table 1), which show elevated levels of these ions compared to typical Delmarva ranges. Salt affects plants primarily through two mechanisms: osmotic stress (reduced water availability) and ionic stress (reduced nutrient availability).
| Nutrient (ppm) | Delmarva Soil Ranges | Salinity Affected Soil |
|---|---|---|
| K | 65-130 | 233 |
| Ca | 426-708 | 1442 |
| Mg | 94-125 | 356 |
| S | 11-33 | 117 |
| B | 0.22-0.46 | 1.7 |
| Na | 7-16 | 810 |
Salinity Effects on Water Availability
Plants absorb water from the soil through a process called osmosis, in which water naturally moves from an area of higher concentration (ideally the soil) to an area of lower concentration (the plant roots). Elevated salt levels in the soil reduce water concentration, making it more difficult for plants to absorb water. At very low salt levels, plants struggle to take up water and maintain proper cell turgor, leading to symptoms similar to drought stress.
Under low to moderate salt conditions, some plants may accumulate salts, which can facilitate water uptake and support moderate growth (Munns and Tester, 2008). However, excessive salt in the soil creates a higher salt concentration outside the roots than inside, limiting water uptake and potentially reversing the osmotic process.
Nutrient Imbalances and Toxicity from Salinity
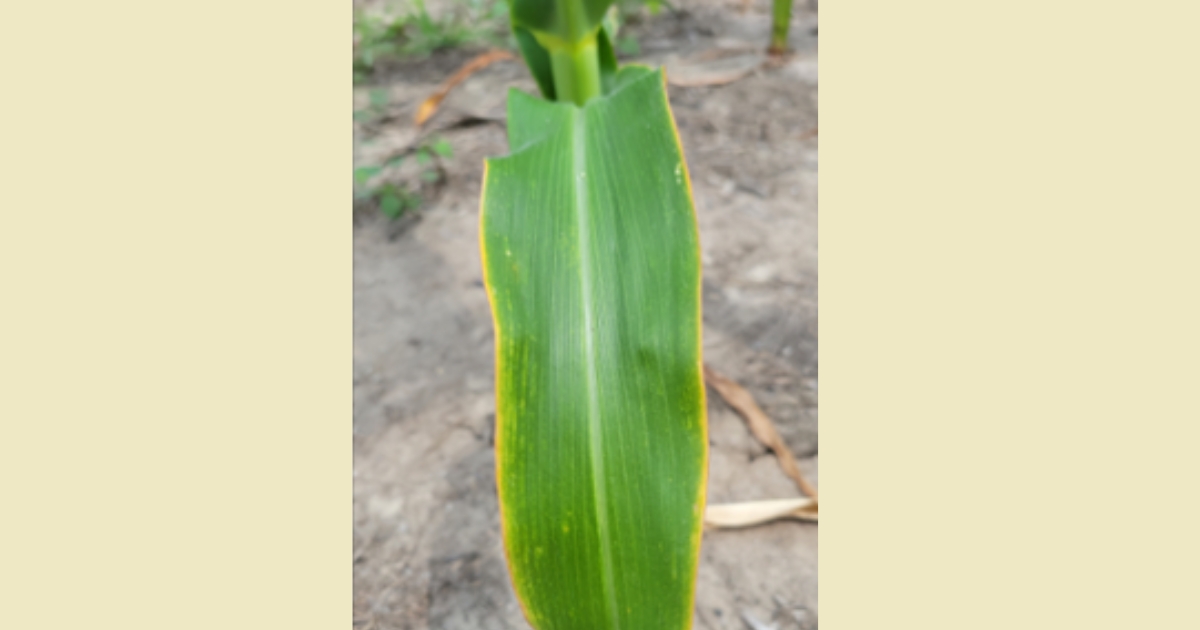
Some ions like K, Ca, Mg, and SO₄ are essential plant nutrients. Sodium, however, is not an essential plant nutrient. When excessive amounts of Na and Cl — a micronutrient required in small quantities — accumulate in the soil, they can build up in plant tissues and cause damage. Excess Na and Cl can lead to cytotoxicity, resulting in symptoms such as leaf firing, tip burn, and necrosis (Figure 1). The severity of these effects varies depending on plant species and growth stage. High Na concentrations can also interfere with the uptake of other essential nutrients, such as K, Ca, and Mg, due to ion competition (Figure 1). Additionally, soils affected by saltwater intrusion (SWI) may have elevated Mg levels, which can further suppress K uptake in grasses.

A sample of corn ear leaves from along the Delmarva coastline (Table 2) illustrates how SWI can lead to nutrient imbalances. While reduced N levels may simply indicate plant stress, affected plants also exhibit higher concentrations of K, Ca, and Mg compared to unaffected plants. These nutrient imbalances can occur even at moderate salinity levels and may not visibly impact plant growth until salinity becomes excessive.
Table 2: Corn ear leaf concentrations in a normal and SWI-affected portion of a Delmarva Field.
| Nutrient | Normal Levels | Salinity Affected |
|---|---|---|
| % N | 2.97 | 1.54 |
| % K | 2.56 | 2.83 |
| % Ca | 0.340 | 0.880 |
| % Mg | 0.259 | 0.772 |
| % S | 0.16 | 0.13 |
Salinity Effects Based on Plant Growth Stages
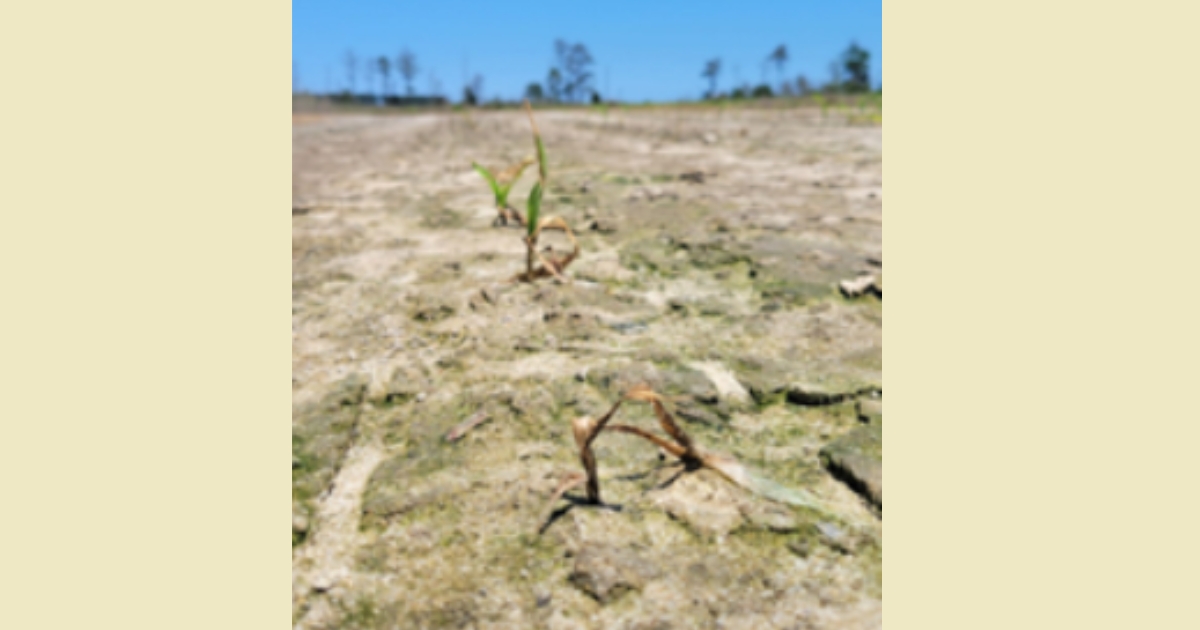
Seed germination begins with water absorption by the dry seed, a process known as imbibition, so osmotic stress is a concern for early growth stages. High salt content in the soil solution makes it harder for seeds to absorb water, slowing or even halting germination. Excessive salinity also interferes with vital processes within the seed, such as energy production, protein synthesis, and hormones that regulate growth. As salt levels increase, water uptake slows, and energy for seedling development becomes limited. In very salty conditions, reactive oxygen species (ROS) can form, damaging seed cells and preventing germination. Even if the seed does germinate, the buildup of Na and Cl can damage the embryo, slowing plant growth (Figure 2).

There is variation in tolerance to salinity among crops and early growth stages (Table 3). While corn is generally considered less salt-tolerant than small grains, it has been observed to be relatively salt-tolerant during germination, with only delays in germination noted (Mass et al., 1983). However, after this stage, corn seedlings become more sensitive to salinity, showing reduced leaf growth, stem elongation, and a lack of new leaf growth (Farooq et al., 2015).
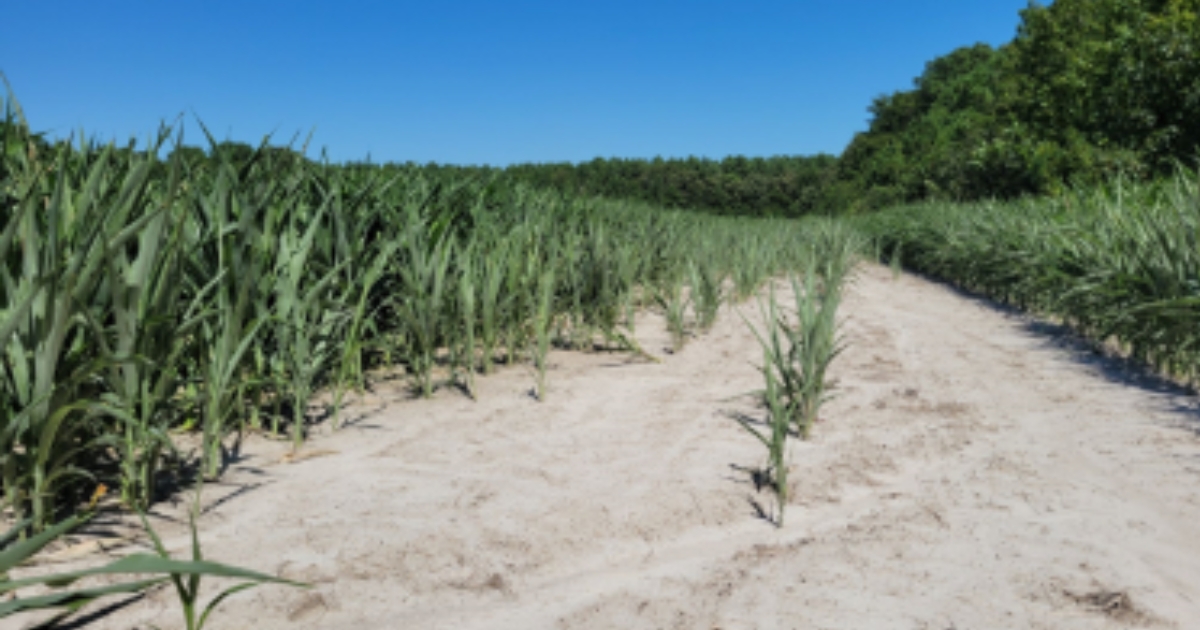
For cereal crops that reach reproductive stages (Figure 3), salinity can reduce grain weight and number and hinder kernel development (Farooq et al., 2015). The crops listed in Table 3 compare the salinity tolerance of various crops grown on Delmarva.

Delmarva Crop Salt Tolerances
Crops exhibit varying tolerance to salinity, with yields declining once a certain salt content is reached. This is measured by electrical conductivity (EC), as salts conduct a current, meaning higher EC is associated with increased salt content. For Delmarva, some typical crops are listed in Table 2, with threshold EC (measured by a saturated paste of the soil, i.e., ECe) predicting when yields may begin to decline. These thresholds may vary depending on soil and salt type (chloride vs. sulfate), but they can still be used for relative comparisons. For example, corn is more tolerant than many vegetables grown on Delmarva, but it is also the least tolerant grain crop.
For fields along the Delmarva coastline, ECe values have ranged from 0.13 to 10.30 dS m⁻¹, with an average of 1.5. The highest salinity ranges would affect almost all potential crops on the shoreline. In contrast, fields without SWI may have ECe values ranging from 0.13 to 0.36 dS/m. While switching to a more salt-tolerant crop may be feasible for fields in the lower ECe range, other fields may require soil management strategies, including conservation easements to establish wetland buffers where crops cannot grow.
This outreach was supported by USDA-NIFA: 2018-68002-27915.
| Common names | Threshold ECe (dS m-1) | Rating |
|---|---|---|
| Grain, Cover, and Fiber Crops | ||
| Red Clover | 1.5 | Moderately sensitive |
| Corn | 1.7 | Moderately sensitive |
| Soybean | 5 | Moderately tolerant |
| Wheat | 6 | Moderately tolerant |
| Cotton | 7.7 | Tolerant |
| Sorghum | 6.8 | Tolerant |
| Barley | 8.0 | Tolerant |
| Rye (cereal) | 11.4 | Tolerant |
| Vegetable and fruit Crops | ||
| Lima Bean | Not available | Moderately tolerant |
| Cucumber | 2.5 | Moderately sensitive |
| Pepper | 1.5 | Moderately sensitive |
| Potato | 1.7 | Moderately sensitive |
| Pumpkin | Not available | Moderately sensitive |
| Tomato | 1.7 | Moderately sensitive |
| Watermelon | Not available | Moderately sensitive |
| Forage and Hay | ||
| Alfalfa | 2.0 | Moderately sensitive |
| Orchardgrass | 1.5 | Moderately sensitive |
| Tall fescue | 3.9 | Moderately tolerant |
References
Farooq, M., Hussain, M., Wakeel, A., & Siddique, K. H. (2015). Salt stress in maize: effects, resistance mechanisms, and management. A review. Agronomy for Sustainable Development, 35, 461-481.
Grieve, C.M., S.R. Grattan and E.V. Maas. 2012. Plant salt tolerance. In: W.W. Wallender and K.K. Tanji (eds.) ASCE Manual and Reports on Engineering Practice No. 71 Agricultural Salinity Assessment and Management (2nd Edition). ASCE, Reston, VA. Chapter 13 pp:405-459.
Maas, E. V., Hoffman, G. J., Chaba, G. D., Poss, J. A., & Shannon, M. C. (1983). Salt sensitivity of corn at various growth stages. Irrigation Science, 4, 45-57.
Millero, F. J., Feistel, R., Wright, D. G., & McDougall, T. J. (2008). The composition of standard seawater and the definition of the reference-composition salinity scale. Deep Sea Research Part I: Oceanographic Research Papers, 55(1), 50-72.
Munns, R., & Tester, M. (2008). Mechanisms of salinity tolerance. Annu. Rev. Plant Biol., 59(1), 651-681. https://doi.org/10.1080/07388551.2019.1654973
Farooq, M., Zahra, N., Ullah, A. et al. Salt Stress in Wheat: Effects, Tolerance Mechanisms, and Management. J Soil Sci Plant Nutr 24, 8151–8173 (2024). https://doi.org/10.1007/s42729-024-02104-1
UD Cooperative Extension
This institution is an equal opportunity provider.
In accordance with Federal law and U.S. Department of Agriculture policy, Cooperative Extension is prohibited from discriminating on the basis of race, color, national origin, sex, age, or disability.
